ChartLogix PHP Bar Graph |
|
|
The BarChart class allows you to draw bar graphs and line graphs. |
|
|
Creating a simple chart |
|
| Create a graph script (which will be an img src), for example - mychart.php: |
|
<?php
include( 'chartlogix.inc.php' );
$chart = new BarChart();
$chart->setTitle( 'This is a bar chart' );
$chart->addColumns( array('Jan','Feb','Mar','Apr','May') );
$chart->doBarSeries( 'Sales', 'FFCC00' );
$chart->addData( 'Jan', 191 );
$chart->addData( 'Feb', 217 );
$chart->addData( 'Mar', 178 );
$chart->addData( 'Apr', 263 );
$chart->addData( 'May', 321 );
$chart->drawPNG( 500, 400 );
|
|
 |
|
|
| Then put an img tag in your HTML refering to the graph script: |
|
<img src="mychart.php" width="500" height="400" />
|
|
|
Line-by-line |
|
|
First, you need to include the ChartLogix PHP file: |
|
include( 'chartlogix.inc.php' );
|
|
|
Then create a new BarChart object: |
|
$chart = new BarChart();
|
|
|
If you want the bar chart image to contain a title you can add it using the setTitle function: |
|
$chart->setTitle( 'This is a bar chart' );
|
|
|
Creating the columns |
|
|
Next, create the columns for the chart. You can either add columns individually using the addColumn function: |
|
// One column for each year
for( $i = 2000; $i <= 2007; $i++ ) $chart->addColumn( $i );
|
|
|
or you can pass an array of column names into the addColumns function: |
|
// One column for each month
$chart->addColumns( array( 'Jan', 'Feb', 'Mar', 'Apr', 'May' ) );
|
|
|
From ChartLogix v1.04 it is no longer necessary to specify the columns before adding the data.
The columns can still be added using addColumns, but if you specify data for a non-existant column
that column will be added automatically. |
|
|
Adding Some Data |
|
|
If you want to use the default style bar chart you can simply start a data series using doBarSeries add data to the columns using the addData function. |
|
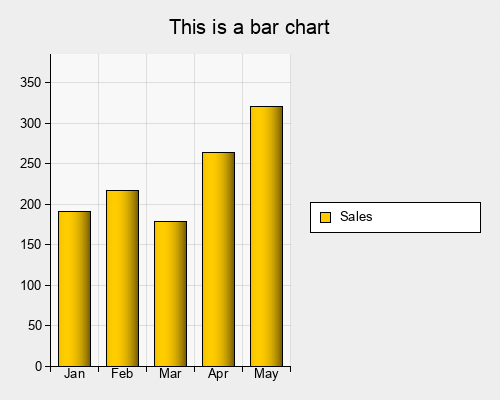
$chart->doBarSeries( 'Sales', 'FFCC00' );
$chart->addData( 'Jan', 191 );
$chart->addData( 'Feb', 217 );
$chart->addData( 'Mar', 178 );
$chart->addData( 'Apr', 263 );
$chart->addData( 'May', 321 );
|
|
 |
|
|
|
This creates a bar chart with orange bars (#FFCC00). |
|
|
Displaying the image |
|
|
To output an image from your PHP script, use the drawPNG function. |
|
$chart->drawPNG( 500, 400 );
|
|
|
To display a CubeLogix pie chart in the web browser, you would use an img tag, and point it's src at the PHP script which creates the pie chart: |
|
<img src="mychart.php" width="500" height="400" />
|
|
|
Next Steps |
|
|
The Adding Data Tutorial tells you more about managing data in your bar charts. |
|
|
The Function Reference Page gives you a complete list of functions which you can use to customise the deisgn of the bar graph. |
|
|
The Bar Graph Designer allows you to interactively customise a bar graph and see the PHP code. |
|