Bar Graph PHP Class - Customising the bars |
|
|
Positioning the bars |
|
|
The gap between the columns can be altered, and the bars in each column can be spaced out or overlapped. |
|
|
Column spacing using setColumnSpacing() |
|
|
The setColumnSpacing( spacing ) function allows you to specify how much space there is between each column.
The function has the same effect for a graph with a single series or with multiple series. |
|
|
A spacing value of 0 means no spacing. |
|
|
A spacing value of 100 means the spacing within each column either side of the bar(s) will be the same width as each bar. |
|
|
|
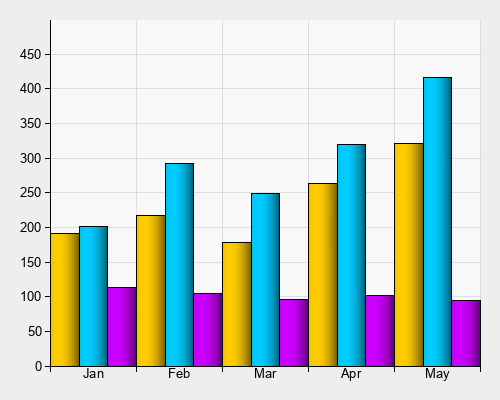
Bars next to each other
setColumnSpacing( 0 ) |
|
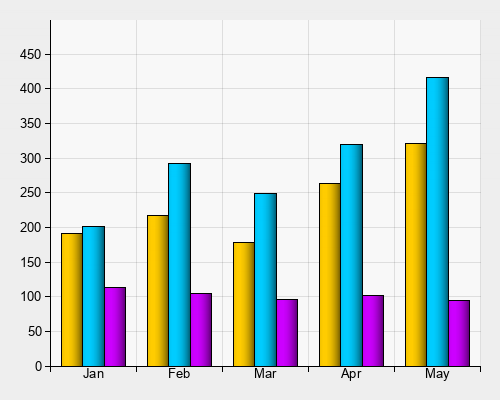
Some spacing
setColumnSpacing( 50 ) |
|
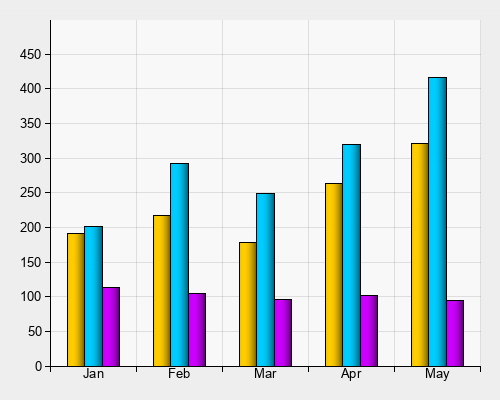
More spacing
setColumnSpacing( 100 ) |
|
|
|
Series spacing |
|
|
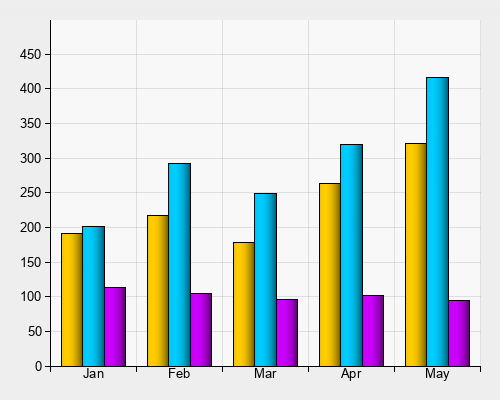
When there are multiple series you can control how they are positioned inside each column
using the setStackedBarSpacing( spacing )
and setStackedBarOverlap( overlap ) functions. |
|
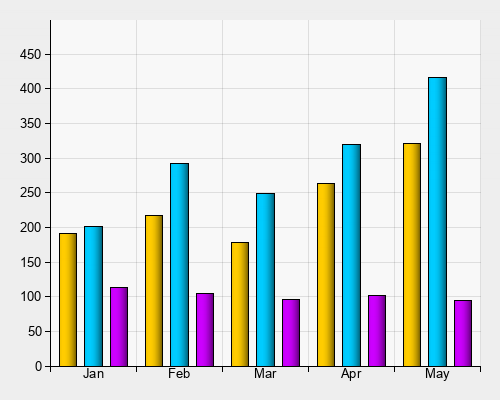
Spacing
setStackedBarSpacing( 50 )
or setStackedBarOverlap( -50 ) |
|
No Spacing
setStackedBarSpacing( 0 )
or setStackedBarOverlap( 0 ) |
|
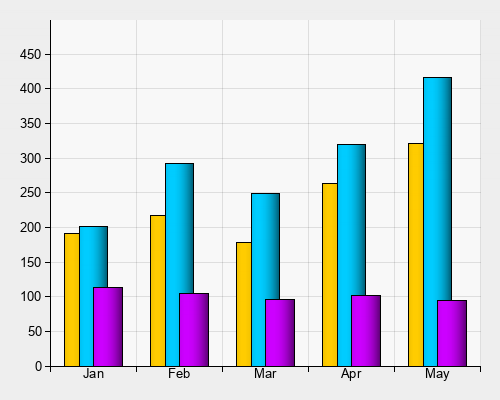
Overlap
setStackedBarSpacing( -50 )
or setStackedBarOverlap( 50 ) |
|
|
|
Displaying values |
|
|
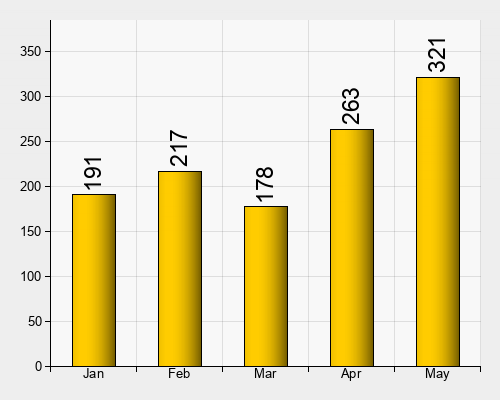
The setValueStyle function allows you to display values above or inside of the bars: |
|
<?php
include( 'chartlogix.inc.php' );
$chart = new BarChart();
$chart->setLegendWidth( 0 );
$chart->setColumnSpacing( 50 );
$chart->doBarSeries( 'MP3 Player Sales', 'FFCC00' );
$chart->addData( 'Jan', 191 );
$chart->addData( 'Feb', 217 );
$chart->addData( 'Mar', 178 );
$chart->addData( 'Apr', 263 );
$chart->addData( 'May', 321 );
$chart->setValueStyle( 'arial.ttf', 17, '000000', 1, 90 );
$chart->drawPNG( 500, 400 );
|
|
 |
|
|
|
The values can be placed above the bars, or at various positions inside the bars, and can be rotated as necessary. The above example uses a position of
1 and an angle of 90 to place the values vertically above the bars. See the function reference for more details. |
|
|
Next Steps |
|
|
The Customizing Axes Tutorial tells you about controlling and positioning the axes. |
|
|
The Function Reference Page gives you a complete list of functions which you can use to customise the deisgn of the bar graph. |
|
|
The Bar Graph Designer allows you to interactively customise a bar graph and see the PHP code. |
|