ChartLogix PHP Pie Chart |
|
|
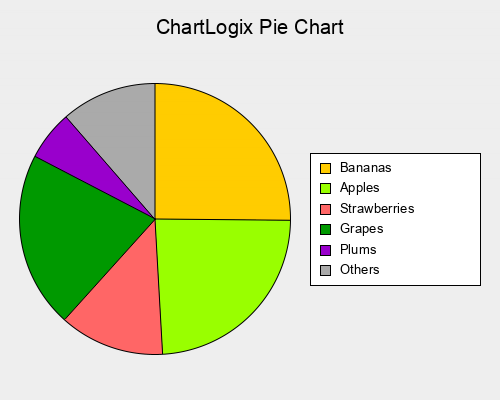
Pie charts are created using the PieChart class, and it requires minimal code to create a pie chart image using the default style. |
|
|
Creating a simple chart |
|
| Create a graph script (which will be an img src), for example - mychart.php: |
|
<?php
include( 'chartlogix.inc.php' );
$pie = new PieChart();
$pie->setTitle( "ChartLogix Pie Chart" );
$pie->addData( 'Bananas', 420, 'FFCC00' );
$pie->addData( 'Apples', 400, '99FF00' );
$pie->addData( 'Strawberries', 210, 'FF6666' );
$pie->addData( 'Grapes', 350, '009900' );
$pie->addData( 'Plums', 100, '9900CC' );
$pie->addData( 'Others', 190, 'AAAAAA' );
$pie->drawPNG( 500, 400 );
|
|
 |
|
|
| Then put an img tag in your HTML refering to the graph script: |
|
<img src="mychart.php" width="500" height="400" />
|
|
|
Line-by-line |
|
|
First, you need to include the ChartLogix PHP file: |
|
include( 'chartlogix.inc.php' );
|
|
|
Then create a new PieChart object: |
|
$pie = new PieChart();
|
|
|
If you want the pie chart image to contain a title you can add it using the setTitle function: |
|
$pie->setTitle( 'This is a pie chart' );
|
|
|
To add values to the pie chart use the addData function: |
|
$pie->addData( 'A Pie Slice', 25, 'FFFF00' );
|
|
|
This adds a yellow pie slice, with a value of 25. Colours are specified as hexadecimal HTML colours. |
|
|
Once you have added all your data, the final step is to output an image to the Web browser: |
|
$pie->drawPNG( 500, 400 );
|
|
|
You specify the width and height in pixels. The drawPNG function sets the correct Content-type in the HTTP header and outputs the image data. |
|
|
To display a CubeLogix pie chart in the web browser, you would use an img tag, and point it's src at the PHP script which creates the pie chart: |
|
<img src="mypie.php" width="500" height="400" />
|
|
|
Next Steps |
|
|
The Examples Page contains some complete PHP scripts which generate pie charts. |
|
|
The Function Reference Page gives you a complete list of functions which you can use to customise the deisgn of the pie chart. |
|
|
The Pie Chart Designer allows you to interactively customise a pie chart and see the PHP code. |
|