|
|
|
| Pie Charts |
|
|
| Line & Bar Graphs |
|
|
| Support |
|
|
|
Bar Graph PHP Class - Adding data |
|
|
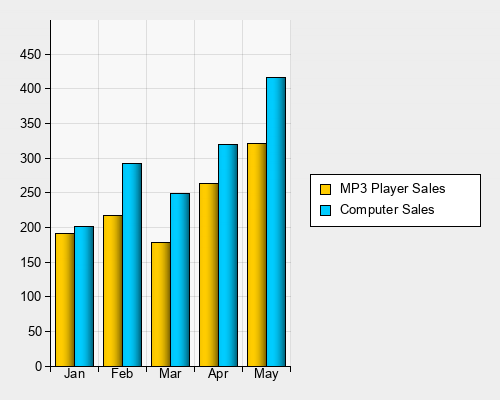
ChartLogix supports multiple series of data plotted onto the same graph. |
|
|
This can be a mixture of line or bar graphs, and the bar graphs can be stacked on top of each other or put side by side. |
|
|
Multiple series of data |
|
|
To display more than one series of data, simply use doBarSeries multiple times: |
|
<?php
include( 'chartlogix.inc.php' );
$chart = new BarChart();
$chart->doBarSeries( 'MP3 Player Sales', 'FFCC00' );
$chart->addData( 'Jan', 191 );
$chart->addData( 'Feb', 217 );
$chart->addData( 'Mar', 178 );
$chart->addData( 'Apr', 263 );
$chart->addData( 'May', 321 );
$chart->doBarSeries( 'Computer Sales', '00CCFF' );
$chart->addData( 'Jan', 201 );
$chart->addData( 'Feb', 292 );
$chart->addData( 'Mar', 249 );
$chart->addData( 'Apr', 320 );
$chart->addData( 'May', 416 );
$chart->drawPNG( 500, 400 );
|
|
 |
|
|
|
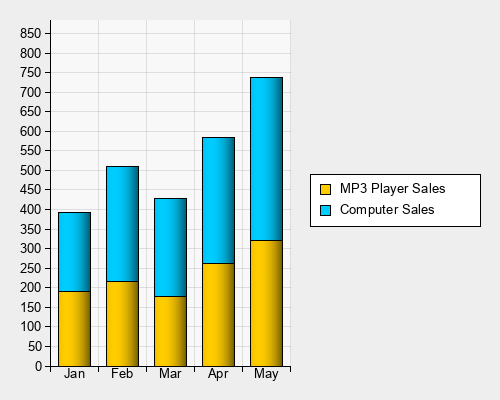
The doStackedBarSeries function can be used to stack the bars, instead of displaying them side-by-side. |
|
<?php
include( 'chartlogix.inc.php' );
$chart = new BarChart();
$chart->doBarSeries( 'MP3 Player Sales', 'FFCC00' );
$chart->addData( 'Jan', 191 );
$chart->addData( 'Feb', 217 );
$chart->addData( 'Mar', 178 );
$chart->addData( 'Apr', 263 );
$chart->addData( 'May', 321 );
// Use doStackedBarSeries to stack this series
// onto the last series
$chart->doStackedBarSeries( 'Computer Sales', '00CCFF' );
$chart->addData( 'Jan', 201 );
$chart->addData( 'Feb', 292 );
$chart->addData( 'Mar', 249 );
$chart->addData( 'Apr', 320 );
$chart->addData( 'May', 416 );
$chart->drawPNG( 500, 400 );
|
|
 |
|
|
|
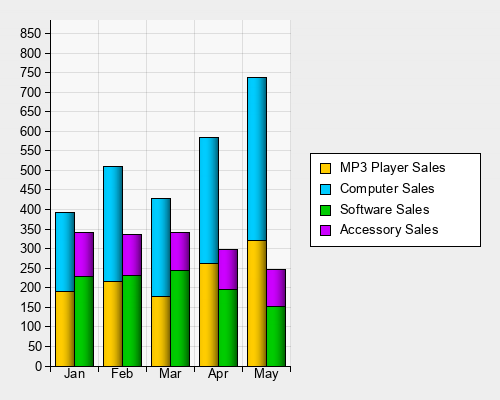
The doStackedBarSeries function causes this series to be stacked on top of the last one. Using doBarSeries after this will create a new stack. |
|
<?php
include( 'chartlogix.inc.php' );
$chart = new BarChart();
$chart->doBarSeries( 'MP3 Player Sales', 'FFCC00' );
$chart->addData( 'Jan', 191 );
$chart->addData( 'Feb', 217 );
$chart->addData( 'Mar', 178 );
$chart->addData( 'Apr', 263 );
$chart->addData( 'May', 321 );
$chart->doStackedBarSeries( 'Computer Sales', '00CCFF' );
$chart->addData( 'Jan', 201 );
$chart->addData( 'Feb', 292 );
$chart->addData( 'Mar', 249 );
$chart->addData( 'Apr', 320 );
$chart->addData( 'May', 416 );
// Start a new stack by using doBarSeries
$chart->doBarSeries( 'Software Sales', '00CC00' );
$chart->addData( 'Jan', 229 );
$chart->addData( 'Feb', 231 );
$chart->addData( 'Mar', 244 );
$chart->addData( 'Apr', 196 );
$chart->addData( 'May', 153 );
// Put this data series onto the new stack
$chart->doStackedBarSeries( 'Accessory Sales', 'CC00FF' );
$chart->addData( 'Jan', 113 );
$chart->addData( 'Feb', 105 );
$chart->addData( 'Mar', 96 );
$chart->addData( 'Apr', 101 );
$chart->addData( 'May', 94 );
$chart->drawPNG( 500, 400 );
|
|
 |
|
|
|
Line graphs |
|
|
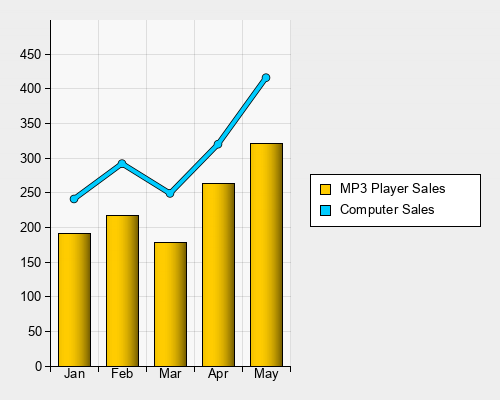
To draw a line graph use the doLineSeries function instead of doBarSeries. You can mix the two types of chart, simply do all your bar series first, then your line series in the same graph. |
|
<?php
include( 'chartlogix.inc.php' );
$chart = new BarChart();
$chart->doBarSeries( 'MP3 Player Sales', 'FFCC00' );
$chart->addData( 'Jan', 191 );
$chart->addData( 'Feb', 217 );
$chart->addData( 'Mar', 178 );
$chart->addData( 'Apr', 263 );
$chart->addData( 'May', 321 );
// Use doLineSeries to draw a line instead of bars
$chart->doLineSeries( 'Computer Sales', '00CCFF' );
$chart->addData( 'Jan', 241 );
$chart->addData( 'Feb', 292 );
$chart->addData( 'Mar', 249 );
$chart->addData( 'Apr', 320 );
$chart->addData( 'May', 416 );
$chart->drawPNG( 500, 400 );
|
|
 |
|
|
|
Using addDataToSeries |
|
|
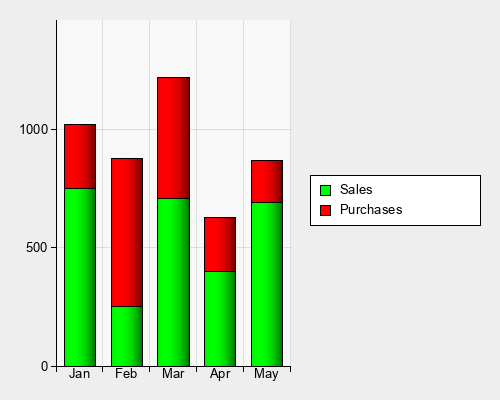
It is often convenient to be able to create all the series first, and then add data to them in any order. |
|
|
For example, if you are putting data from a database into a chart you might be fetching rows which each contain data for multiple
series. |
|
|
Adding data using addDataToSeries function allows you to do this. |
|
<?php
include( 'chartlogix.inc.php' );
// This is an example of using the addDataToSeries function
$chart = new BarChart();
// Create all the series first
$chart->doBarSeries( 'Sales', '00FF00' );
$chart->doStackedBarSeries( 'Purchases', 'FF0000' );
// Now add data to each column
// addDataToSeries( series name, column name, data value )
$chart->addDataToSeries( 'Sales', 'Jan', 750 );
$chart->addDataToSeries( 'Purchases', 'Jan', 270 );
$chart->addDataToSeries( 'Sales', 'Feb', 250 );
$chart->addDataToSeries( 'Purchases', 'Feb', 630 );
$chart->addDataToSeries( 'Sales', 'Mar', 710 );
$chart->addDataToSeries( 'Purchases', 'Mar', 510 );
$chart->addDataToSeries( 'Sales', 'Apr', 400 );
$chart->addDataToSeries( 'Purchases', 'Apr', 230 );
$chart->addDataToSeries( 'Sales', 'May', 690 );
$chart->addDataToSeries( 'Purchases', 'May', 180 );
// Output the image
$chart->drawPNG( 500, 400 );
|
|
 |
|
|
|
Next Steps |
|
|
The Customizing Bars Tutorial tells you more about layout and graphical effects for the bars. |
|
|
The Function Reference Page gives you a complete list of functions which you can use to customise the deisgn of the bar graph. |
|
|
The Bar Graph Designer allows you to interactively customise a bar graph and see the PHP code. |
|
|