|
|
|
| Pie Charts |
|
|
| Line & Bar Graphs |
|
|
| Support |
|
|
|
Bar Graph PHP Class - Customizing the axes |
|
|
Axis labels & numbering |
|
|
The labels on the axes are automatically generated. The X axis has the column names and the Y axis has the values.
The Y axis is automatically scaled to leave some space above the highest bar, but you can change the Y axis extent manually
using the setYAxisMaximum function. |
|
|
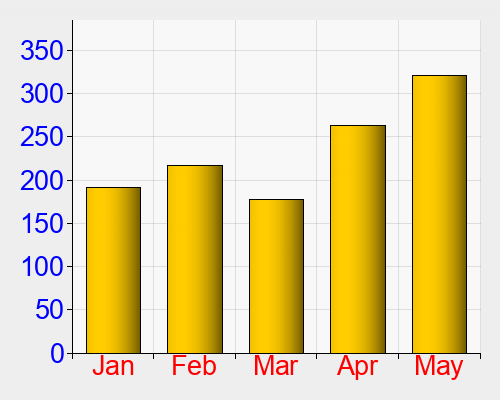
You can use the setXAxisTextStyle
and setYAxisTextStyle. |
|
<?php
include( 'chartlogix.inc.php' );
$chart = new BarChart();
$chart->setLegendWidth( 0 );
$chart->setXAxisTextStyle( 'arial.ttf', 20, 'FF0000' );
$chart->setYAxisTextStyle( 'arial.ttf', 20, '0000FF' );
$chart->doBarSeries( 'MP3 Player Sales', 'FFCC00' );
$chart->addData( 'Jan', 191 );
$chart->addData( 'Feb', 217 );
$chart->addData( 'Mar', 178 );
$chart->addData( 'Apr', 263 );
$chart->addData( 'May', 321 );
$chart->drawPNG( 500, 400 );
|
|
 |
|
|
|
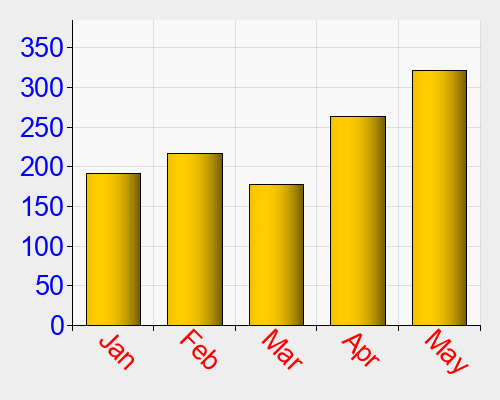
The X axis labels can be rotated using the optional 4th parameter ofsetXAxisTextStyle
- this is useful if you are displaying lots of data or the labels are long and do not fit in the columns. |
|
<?php
include( 'chartlogix.inc.php' );
$chart = new BarChart();
$chart->setLegendWidth( 0 );
$chart->setXAxisTextStyle( 'arial.ttf', 20, 'FF0000', 45 );
$chart->setYAxisTextStyle( 'arial.ttf', 20, '0000FF' );
$chart->doBarSeries( 'MP3 Player Sales', 'FFCC00' );
$chart->addData( 'Jan', 191 );
$chart->addData( 'Feb', 217 );
$chart->addData( 'Mar', 178 );
$chart->addData( 'Apr', 263 );
$chart->addData( 'May', 321 );
$chart->drawPNG( 500, 400 );
|
|
 |
|
|
|
Axis titles |
|
|
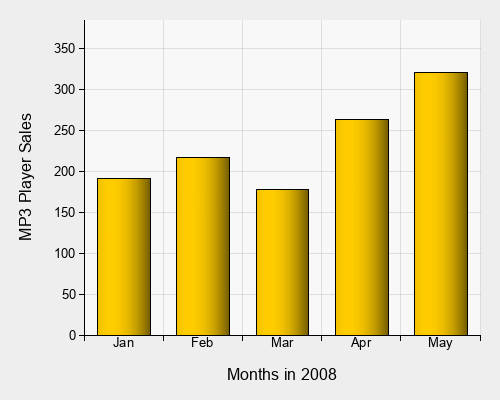
You can independently set the titles for the left, right, top and bottom edges of the graph. |
|
<?php
include( 'chartlogix.inc.php' );
$chart = new BarChart();
$chart->setLegendWidth( 0 );
$chart->setLeftAxisTitle( 'MP3 Player Sales' );
$chart->setBottomAxisTitle( 'Months in 2008' );
$chart->doBarSeries( 'MP3 Player Sales', 'FFCC00' );
$chart->addData( 'Jan', 191 );
$chart->addData( 'Feb', 217 );
$chart->addData( 'Mar', 178 );
$chart->addData( 'Apr', 263 );
$chart->addData( 'May', 321 );
$chart->drawPNG( 500, 400 );
|
|
 |
|
|
|
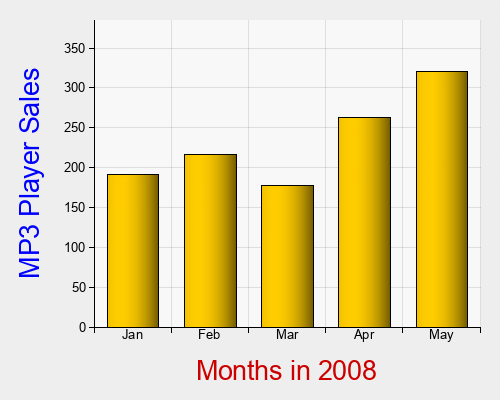
You can set the style of the X and Y axis titles using the setXAxisTitleStyle and setYAxisTitleStyle functions. |
|
<?php
include( 'chartlogix.inc.php' );
$chart = new BarChart();
$chart->setLegendWidth( 0 );
$chart->setXAxisTitleStyle( 'arial.ttf', 20, 'CC0000' );
$chart->setYAxisTitleStyle( 'arial.ttf', 20, '0000FF' );
$chart->setLeftAxisTitle( 'MP3 Player Sales' );
$chart->setBottomAxisTitle( 'Months in 2008' );
$chart->doBarSeries( 'MP3 Player Sales', 'FFCC00' );
$chart->addData( 'Jan', 191 );
$chart->addData( 'Feb', 217 );
$chart->addData( 'Mar', 178 );
$chart->addData( 'Apr', 263 );
$chart->addData( 'May', 321 );
$chart->drawPNG( 500, 400 );
|
|
 |
|
|
|
Moving the axes |
|
|
By default, the Y Axis is on the left of the graph, and the X axis is along the bottom. |
|
|
ChartLogix allows you to put the axes on on any side of the graph. |
|
|
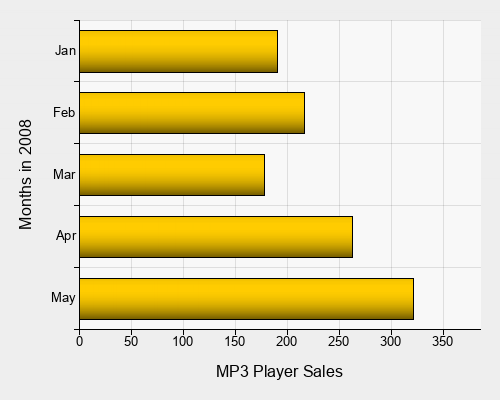
If you simply wish to have a horizontal graph this can be acheived with the setGraphOrientation function: |
|
<?php
include( 'chartlogix.inc.php' );
$chart = new BarChart();
$chart->setLegendWidth( 0 );
$chart->setGraphOrientation( 1 );
$chart->setLeftAxisTitle( 'Months in 2008' );
$chart->setBottomAxisTitle( 'MP3 Player Sales' );
$chart->doBarSeries( 'MP3 Player Sales', 'FFCC00' );
$chart->addData( 'Jan', 191 );
$chart->addData( 'Feb', 217 );
$chart->addData( 'Mar', 178 );
$chart->addData( 'Apr', 263 );
$chart->addData( 'May', 321 );
$chart->drawPNG( 500, 400 );
|
|
 |
|
|
|
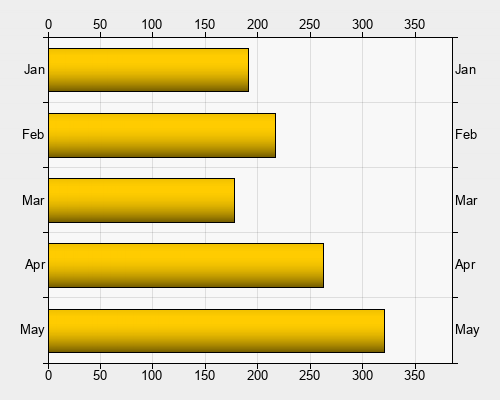
Otherwise, you can specify axes for each side of the graph individually: |
|
<?php
include( 'chartlogix.inc.php' );
$chart = new BarChart();
$chart->setLegendWidth( 0 );
$chart->clearAxes();
$chart->setLeftAxis( 'x' );
$chart->setRightAxis( 'x' );
$chart->setBottomAxis( 'y' );
$chart->setTopAxis( 'y' );
$chart->doBarSeries( 'MP3 Player Sales', 'FFCC00' );
$chart->addData( 'Jan', 191 );
$chart->addData( 'Feb', 217 );
$chart->addData( 'Mar', 178 );
$chart->addData( 'Apr', 263 );
$chart->addData( 'May', 321 );
$chart->drawPNG( 500, 400 );
|
|
 |
|
|
|
Next Steps |
|
|
The Function Reference Page gives you a complete list of functions which you can use to customise the deisgn of the bar graph. |
|
|
The Bar Graph Designer allows you to interactively customise a bar graph and see the PHP code. |
|
|